This TA and App is now deprecated and will no longer receive updates or support. For continued support and future updates, please switch to the new app supported by Splunk.
Please follow the documentation for a migration path to use the Splunk supported Splunk App for Palo Alto Networks.
Please follow the documentation for a migration path to use the Splunk supported Splunk Add-on for Palo Alto Networks.
Cortex XDR
Cortex XDR is supported starting with App/Add-on 7.0.0.
Cortex XDR is cloud-hosted so logs are retrieved by Splunk using the Cortex XDR API's. Logs are pulled down in JSON format with sourcetype="pan:xdr_incident".
Create API Key in Cortex XDR
Use the instruction in the Cortex XDR Getting Started Guide to gain API access:
Use these values to generate the API key:
| Security Level | Role |
|---|---|
| Advanced | Viewer |
This action will provide you a Key and Key ID. The Key be shown only once, so make sure to record it or you'll need to re-create the Key.
Create Cortex XDR Input and add Key to Splunk
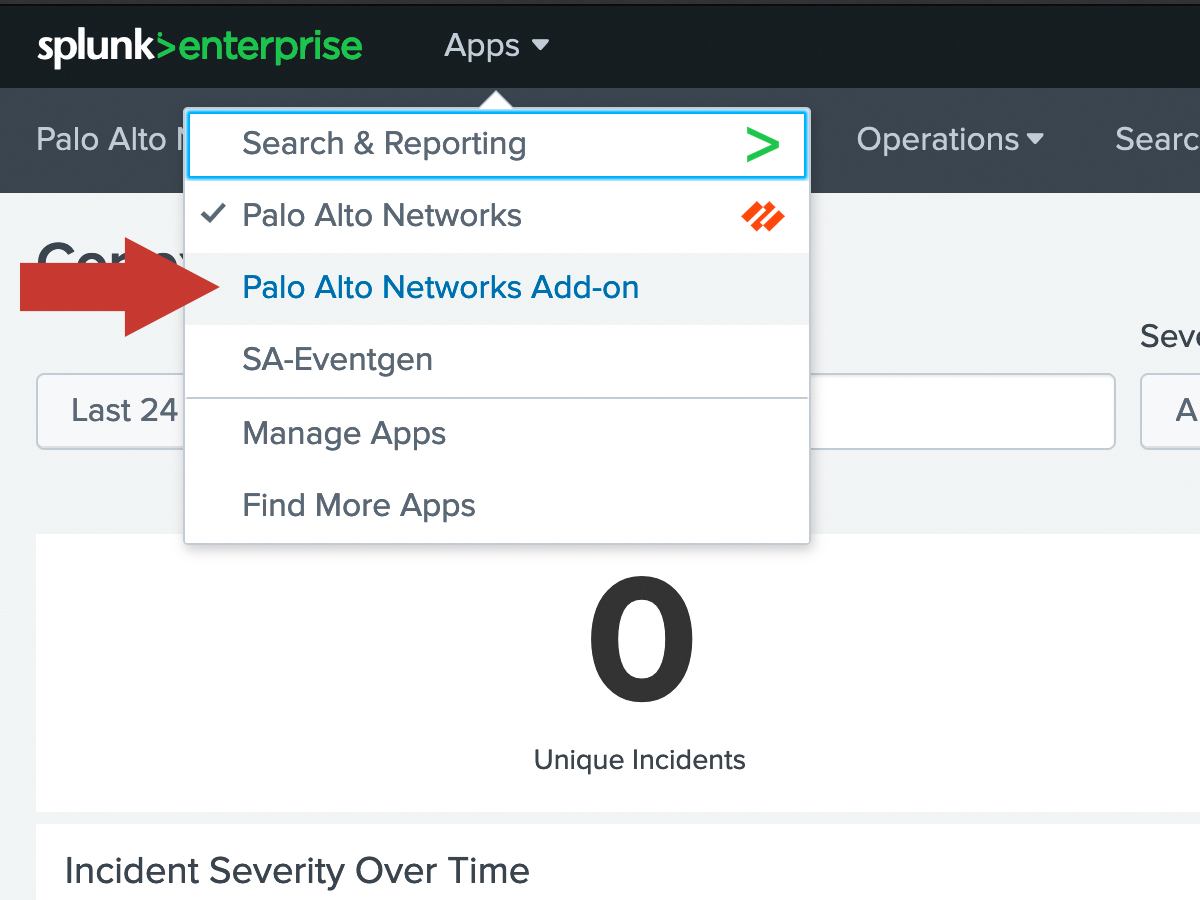
In Splunk, navigate to the Palo Alto Networks Add-on.
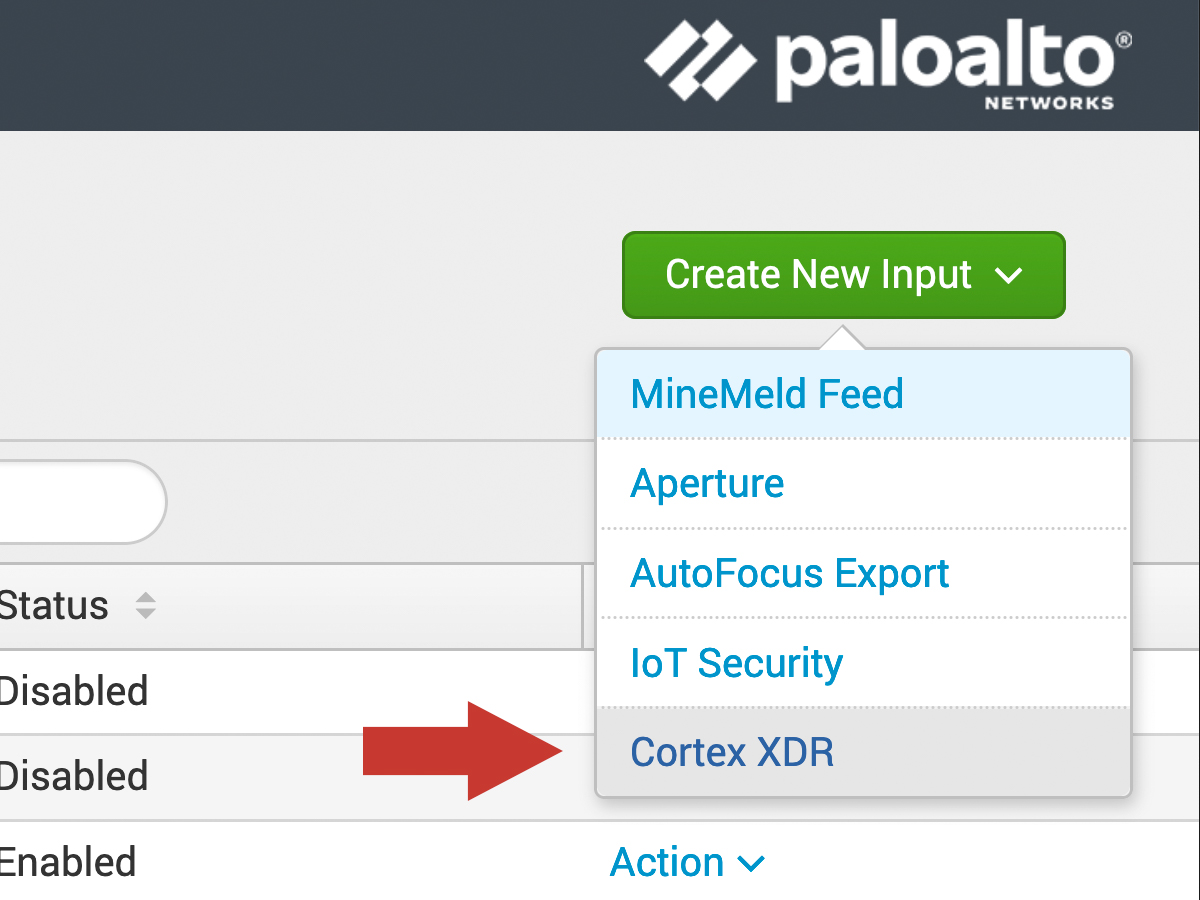
Within the Add-on, click the Input tab at the top left. Then click Create New Input and select Cortex XDR.
In the dialog window, enter the following:
| Field | Value |
|---|---|
| Name | Any friendly name (eg. "cortex_xdr") |
| Interval | Frequency in seconds to check for new logs (60 seconds recommended) |
| Index | The index in which to put the Cortex XDR incidents |
| Tenant Name | Found in the hostname when accessing Cortex XDR. (eg. https:// <tenantname>.xdr. <tenantregion>.paloaltonetworks.com) |
| API Key ID | Enter Key ID |
| API Key | Enter Key |
Then click Add to save the modular input.
Verify
After waiting the interval time, check that logs are coming into Splunk by clicking Search at the top and entering this search:
sourcetype="pan:xdr_incident"
You should see some JSON formatted logs show up. If nothing shows up, wait a little longer, ensure there is activity in Cortex XDR to generate logs, and try the Troubleshooting Guide.