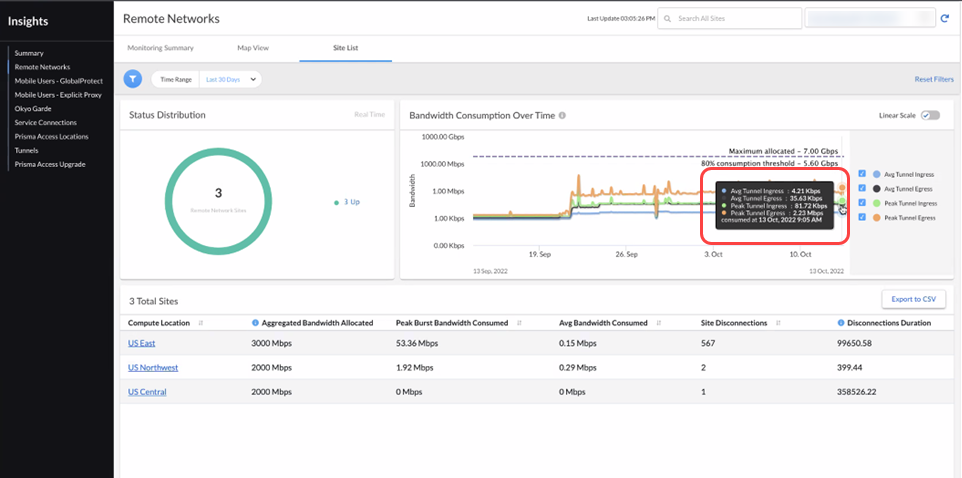
Remote Network Bandwidth Consumption Over Time
You can view the ingress, egress, average, and peak bandwidth consumption over time using the tunnel_status resource.
The information returned by this query can also be viewed in the UI, here:
API Calls
1.0 Call
POST /api/sase/v1.0/resource/tenant/{super_tenant_id}/query/tunnel_status

Authorization: Bearer {{jwt_token}}

Content-Type: application/json
2.0 Call
POST /api/sase/v2.0/resource/query/tunnel_status

Prisma-Tenant:{{tsg_id}}

Authorization: Bearer {{jwt_token}}

Content-Type: application/json
Request Payload
The following request payload filters on
node_type
and event_time. The operators for event_time are:
last_n_minutes: n = 15.last_n_hours: n = 1, 3, 24, or 48.last_n_days: n = 7, 30, or 90.
{
  "histogram": {
    "property": "event_time",
    "enableEmptyInterval": true,
    "range": "day",
    "value": "30"
  },
  "properties": [
    {
      "function": "avg",
      "format": {
        "function": "round",
        "value": 2
      },
      "property": "tunnel_throughput_ingress",
      "alias": "avg_ingress"
    },
    {
      "function": "avg",
      "format": {
        "function": "round",
        "value": 2
      },
      "property": "tunnel_throughput_egress",
      "alias": "avg_egress"
    },
    {
      "function": "max",
      "format": {
        "function": "round",
        "value": 2
      },
      "property": "tunnel_throughput_ingress",
      "alias": "peak_ingress"
    },
    {
      "function": "max",
      "format": {
        "function": "round",
        "value": 2
      },
      "property": "tunnel_throughput_egress",
      "alias": "peak_egress"
    }
  ],
  "filter": {
    "rules": [
      {
        "property": "node_type",
        "operator": "equals",
        "values": [48]
      },
      {
        "property": "event_time",
        "operator": "last_n_days",
        "values": [30]
      }
    ]
  },
  "count": 100
}
Request Response
{
  "header": {
    "createdAt": "2022-10-13T22:09:43Z",
    "dataCount": 2,
    "requestId": "8d730b93-c491-47fa-b9be-91a9b7077d33",
    "queryInput": {
      "time_range": "last 30 day(s)",
      "event_time": {
        "from": "2022-09-13T00:00:00Z",
        "to": "2022-10-13T22:08:59Z",
        "from_epoch": 1663027200000,
        "to_epoch": 1665698939000
      },
      "histogram": true,
      "histogram_range": "day",
      "histogram_value": "30"
    },
    "status": {
      "subCode": 200
    }
  },
  "data": [
    {
      "histogram_time": 1663027200000,
      "event_time": 1663027200000,
      "avg_ingress": 3.7,
      "avg_egress": 30.41,
      "peak_ingress": 1107.7,
      "peak_egress": 53359.63
    },
    {
      "histogram_time": 1665619200000,
      "event_time": 1665619200000,
      "avg_ingress": 4.14,
      "avg_egress": 34.32,
      "peak_ingress": 81.72,
      "peak_egress": 2233.04
    }
  ]
}