Raised Alerts Over Time
You can view new raised alerts using the prisma_sase_external_alerts_current resource.
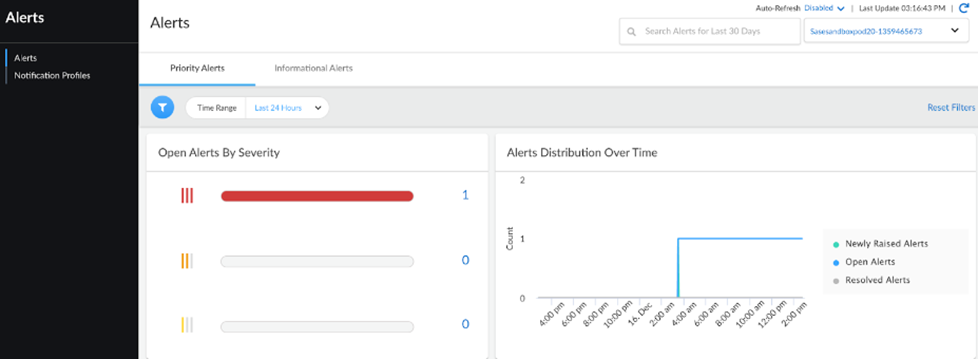
The information returned by this query can also be viewed in the UI, here:
API Call
2.0 Call
POST /api/sase/v2.0/resource/query/prisma_sase_external_alerts_current

Prisma-Tenant:{{tsg_id}}

Authorization: Bearer {{jwt_token}}

Content-Type: application/json
Request Payload
The following request payload uses the alert_id, raised_time, and severity filters:
alert_id : Unique alert ID.
raised_time : string, format example 2021-07-02 23:12:13 UTC
severity : The values for this filter are:
4: High severity3: Medium severity2: Low severity1: Informational alert
{
   "properties": [{
       "property": "alert_id",
       "function": "distinct_count",
       "alias": "count"
   }],
   "histogram": {
       "property": "raised_time",
       "enableEmptyInterval": True,
       "range": "hour",
       "value": "3"
   },
   "filter": {
       "rules": [{

           "property": "severity",
           "operator": "not_in",
           "values": ["Notification"]
       }, {
           "property": "raised_time",
           "operator": "between",
           "values": [1671868800000,1674516687000]
       }]
   }
}
Request Response
{
  "header": {
    "createdAt": "2022-12-16T23:30:52Z",
    "rowCount": 1,
    "requestId": "bfea7cd4-0470-45c1-808c-1234e6b39a54"
  },
  "data": [
    {
      "header": {
        "createdAt": "2022-12-16T23:30:52Z",
        "rowCount": 5,
        "requestId": "bfea7cd4-0470-45c1-808c-1234e6b39a54:1",
        "name": "newRaisedAlerts",
        "queryInput": {
          "time_range": "custom",
          "event_time": {
            "from": "2022-12-16T08:23:50Z",
            "to": "2022-12-16T22:49:07Z",
            "from_epoch": 1671179030000,
            "to_epoch": 1671230947000
          },
          "histogram": true,
          "histogram_range": "hour",
          "histogram_value": "3"
        }
      },
      "data": [
        {
          "histogram_time": 1671179030000
        },
        {
          "histogram_time": 1671189830000,
          "raised_time": 1671189830000,
          "count": 1
        },
        {
          "histogram_time": 1671200630000
        },
        {
          "histogram_time": 1671211430000
        },
        {
          "histogram_time": 1671222230000
        }
      ]
    }
  ]
}