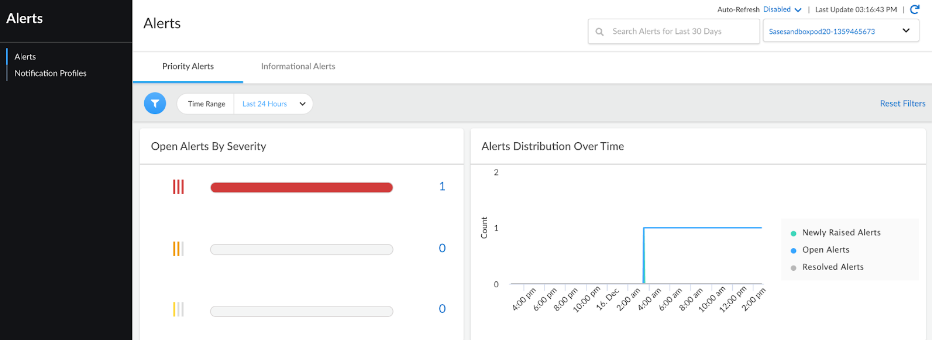
Open Alerts Over Time
You can view new open alerts using the open_alerts_count_timeseries resource.
The information returned by this query can also be viewed in the UI, here:
API Call
2.0 Call
POST /api/sase/v2.0/resource/custom/query/open_alerts_count_timeseries

Prisma-Tenant:{{tsg_id}}

Authorization: Bearer {{jwt_token}}

Content-Type: application/json
Request Payload
The following request payload uses the customerApp and updated_time filters:
customerApp : (optional) If True, only external alerts are processed.
updated_time : string, format example 2021-07-03 23:12:13 UTC
{
  "histogram": {
    "property": "updated_time",
    "enableEmptyInterval": true,
    "range": "hour",
    "value": "3"
  },
  "filter": {
    "rules": [
      {
        "property": "customerApp",
        "operator": "equals",
        "values": ["true"]
      },
      {
        "property": "updated_time",
        "operator": "between",
        "values": [1671179030000, 1671230947371]
      }
    ]
  }
}
Request Response
{
  "header": {
    "createdAt": "2022-12-16T23:14:43Z",
    "dataCount": 5,
    "requestId": "7808fcfe-65b9-4ff1-85b8-0dd59d89dac2",
    "queryInput": {
      "time_range": "custom",
      "event_time": {
        "from": "2022-12-16T08:23:50Z",
        "to": "2022-12-16T22:49:07Z",
        "from_epoch": 1671179030000,
        "to_epoch": 1671230947000
      },
      "histogram": true,
      "histogram_range": "hour",
      "histogram_value": "3"
    },
    "status": {
      "subCode": 200
    }
  },
  "data": [
    {
      "histogram_time": 1671179030000,
      "count": 0
    },
    {
      "histogram_time": 1671189830000,
      "count": 1
    },
    {
      "histogram_time": 1671200630000,
      "count": 1
    },
    {
      "histogram_time": 1671211430000,
      "count": 1
    },
    {
      "histogram_time": 1671222230000,
      "count": 1
    }
  ]
}