External Alerts Current
You can view the alert count by severity using the prisma_sase_external_alerts_current resource.
The information returned by this query can also be viewed in the UI, here:
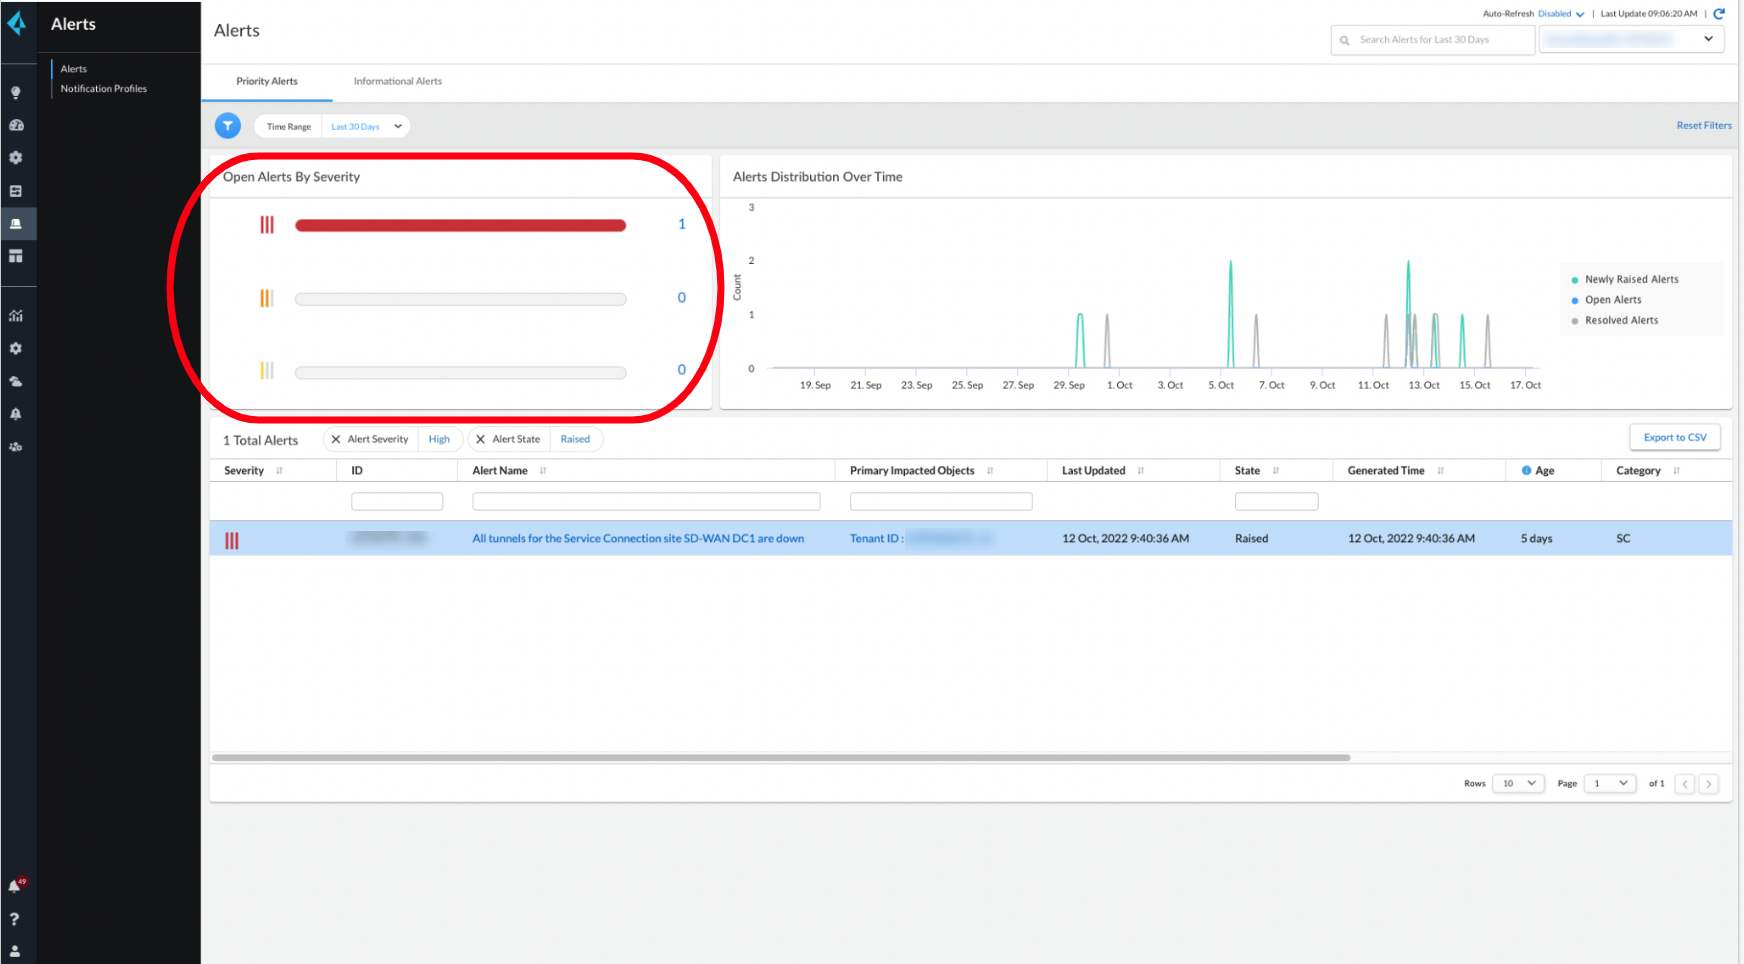
API Calls
1.0 Call
POST /api/sase/v1.0/resource/tenant/{super_tenant_id}/query/prisma_sase_external_alerts_current

Authorization: Bearer {{jwt_token}}

Content-Type: application/json
2.0 Call
POST /api/sase/v2.0/resource/query/prisma_sase_external_alerts_current

Prisma-Tenant:{{tsg_id}}

Authorization: Bearer {{jwt_token}}

Content-Type: application/json
Request Payload
The following request payload uses the state, severity, and updated_time filters:
state : The values for this filter are:
Raised: The alert has been raised to an IT specialist's attention.Cleared: The alert has been cleared.
severity : The values for this filter are:
4: High severity3: Medium severity2: Low severity1: Informational alert
updated_time : string, format example 2021-07-03 23:12:13 UTC
{
  "properties": [
    {
      "property": "severity"
    },
    {
      "property": "severity_id"
    },
    {
      "function": "distinct_count",
      "property": "alert_id",
      "alias": "count"
    }
  ],
  "filter": {
    "rules": [
      {
        "property": "state",
        "operator": "in",
        "values": ["Raised", "RaisedChild"]
      },
      {
        "property": "severity",
        "operator": "not_in",
        "values": ["Notification"]
      },
      {
        "property": "updated_time",
        "operator": "between",
        "values": [1663184377012, 1665776376012]
      }
    ]
  },
  "count": 100
}
Request Response
{
  "header": {
    "createdAt": "2022-10-17T15:58:57Z",
    "dataCount": 1,
    "requestId": "4cab13eb-f670-4596-8964-0f809b980f22",
    "queryInput": {
      "time_range": "custom",
      "event_time": {
        "from": "2022-09-14T19:39:37Z",
        "to": "2022-10-14T19:39:36Z",
        "from_epoch": 1663184377000,
        "to_epoch": 1665776376000
      }
    },
    "status": {
      "subCode": 200
    }
  },
  "data": [
    {
      "severity": "High",
      "severity_id": 4,
      "count": 1
    }
  ]
}