Get Timeseries of Application Performance Metrics for an Application Test
This API retrieves the Timeseries of the Application Performance Metrics for a particular application test.
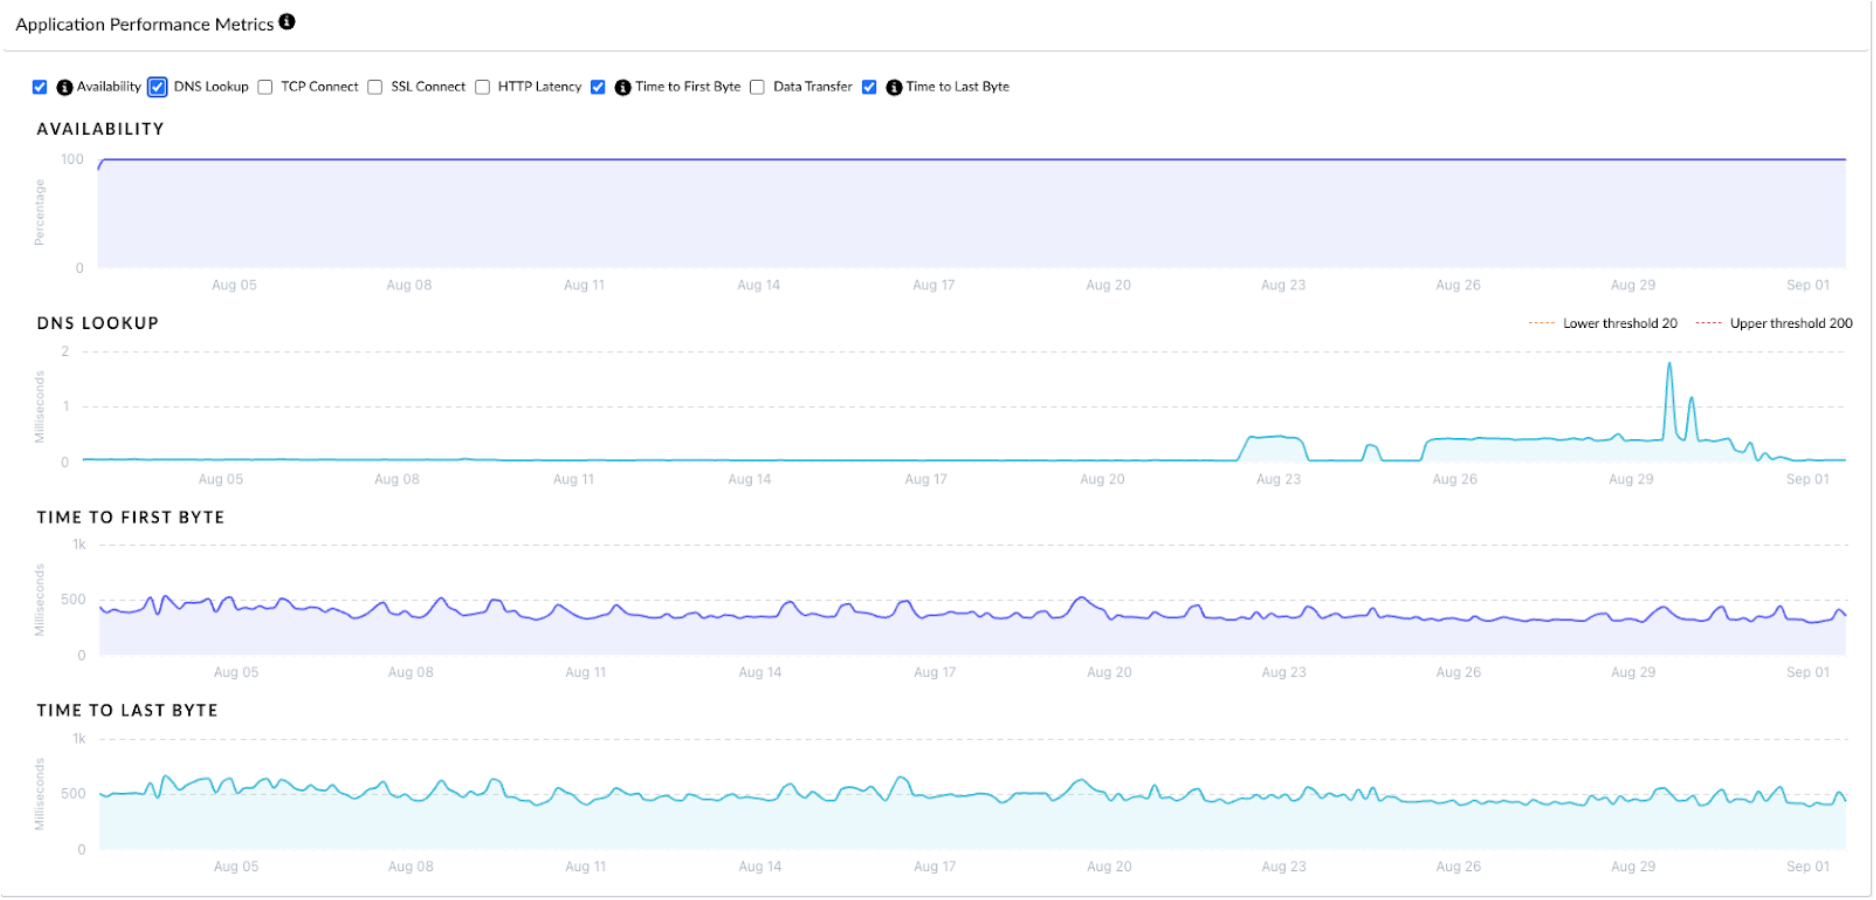
In the Response section, the availability is 100% when it is 1. The graph shows the availability as 0.9 which is close to 1 indicating that the availability is close to 100%.
The following shows the portions of the UI widget where the data is displayed for this example:

Request
GET https://api.sase.paloaltonetworks.com//adem/telemetry/v2/measure/application/metric? timerange=last_30_day&filter=testUuid==3100bb11-dde4-4ab9-8503-d0c6ad5f9698&endpoint-type=muAgent&response-type=timeseries

header = { "prisma-tenant": "<tenant-id>" }
Response
{
    "startTime": 1691010000,
    "endTime": 1693602000,
    "endpointType": "muAgent",
    "tenantServiceGroup": [
          "<tenant-id>:<subtenant-id>”
    ],
    "samplePeriod": 10800,
    "series": [
        {
            "_rowCount": 351,
            "dnsLookupTime": 46.5,   <<<<<<
            "maxDnsLookupTime": 408,
            "throughput": 767161.6,
            "maxThroughput": 2836784,
            "tcpHandshakeTime": 80556.8,
            "maxTcpHandshakeTime": 3608379,
            "sslHandshakeTime": 161810.9,
            "maxSslHandshakeTime": 8302431,
            "waitTime": 186277.4,
            "maxWaitTime": 1608543,
            "dataTransferTime": 67118.8,
            "maxDataTransferTime": 2269218,
            "timeToFirstByte": 428691.5,   <<<<<<
            "maxTimeToFirstByte": 9268485,
            "totalTime": 511078.7,
            "wireSize": 18130.7,
            "availability": 0.9,   <<<<<<
            "sample": 1691010000
        },…..
]
}