Get Timeseries Data of Application Performance for all Applications
This API retrieves the timeseries data of application performance for all applications.
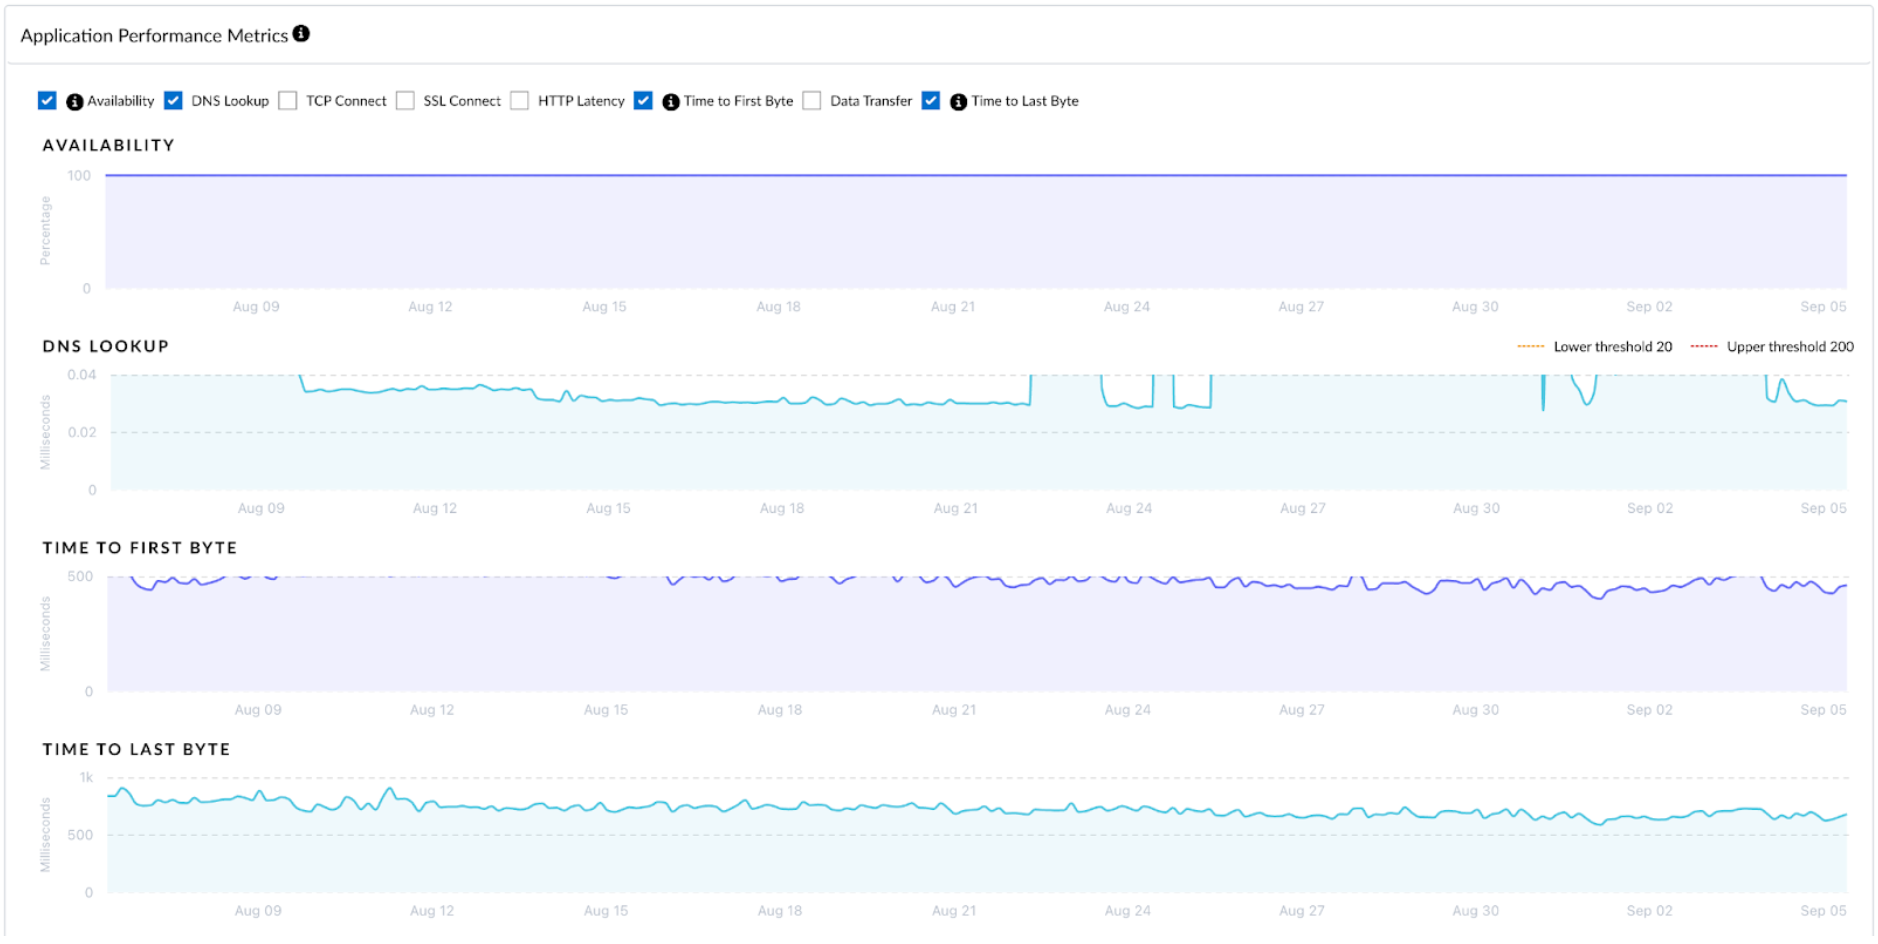
In the Response section, the values shown for each field that is followed by a comment (<<<<<<), for example dnsLookupTime, are the average values for that field in the timeseries. The availability is always 100% which is indicated by 1.
The following shows the portions of the UI widget where the data is displayed for this example:
Request
GET https://api.sase.paloaltonetworks.com//adem/telemetry/v2/measure/application/metric? timerange=last_30_day&endpoint-type=muAgent&response-type=timeseries

header = { "prisma-tenant": "<tenant-id>" }
Response
{
    "startTime": 1691334000,
    "endTime": 1693926000,
    "endpointType": "muAgent",
    "tenantServiceGroup": [
        "xxx:xxx"
    ],
    "samplePeriod": 10800,
    "series": [
        {
            "_rowCount": 3580,
            "dnsLookupTime": 42.8,   <<<<<<
            "maxDnsLookupTime": 530,
            "throughput": 3316902.9,
            "maxThroughput": 75128344,
            "tcpHandshakeTime": 82406.2,
            "maxTcpHandshakeTime": 1521664,
            "sslHandshakeTime": 197720.8,
            "maxSslHandshakeTime": 10583855,
            "waitTime": 245688.1,
            "maxWaitTime": 13142609,
            "dataTransferTime": 264332,
            "maxDataTransferTime": 15013933,
            "timeToFirstByte": 525857.4,   <<<<<<
            "maxTimeToFirstByte": 13879987,
            "totalTime": 828298.6,
            "wireSize": 65611.4,
            "availability": 1,   <<<<<<
            "sample": 1691334000
        },
…..
]
}