Get Network Performance Metrics for an Application
This API retrieves the Network Performance Metrics for a given application.
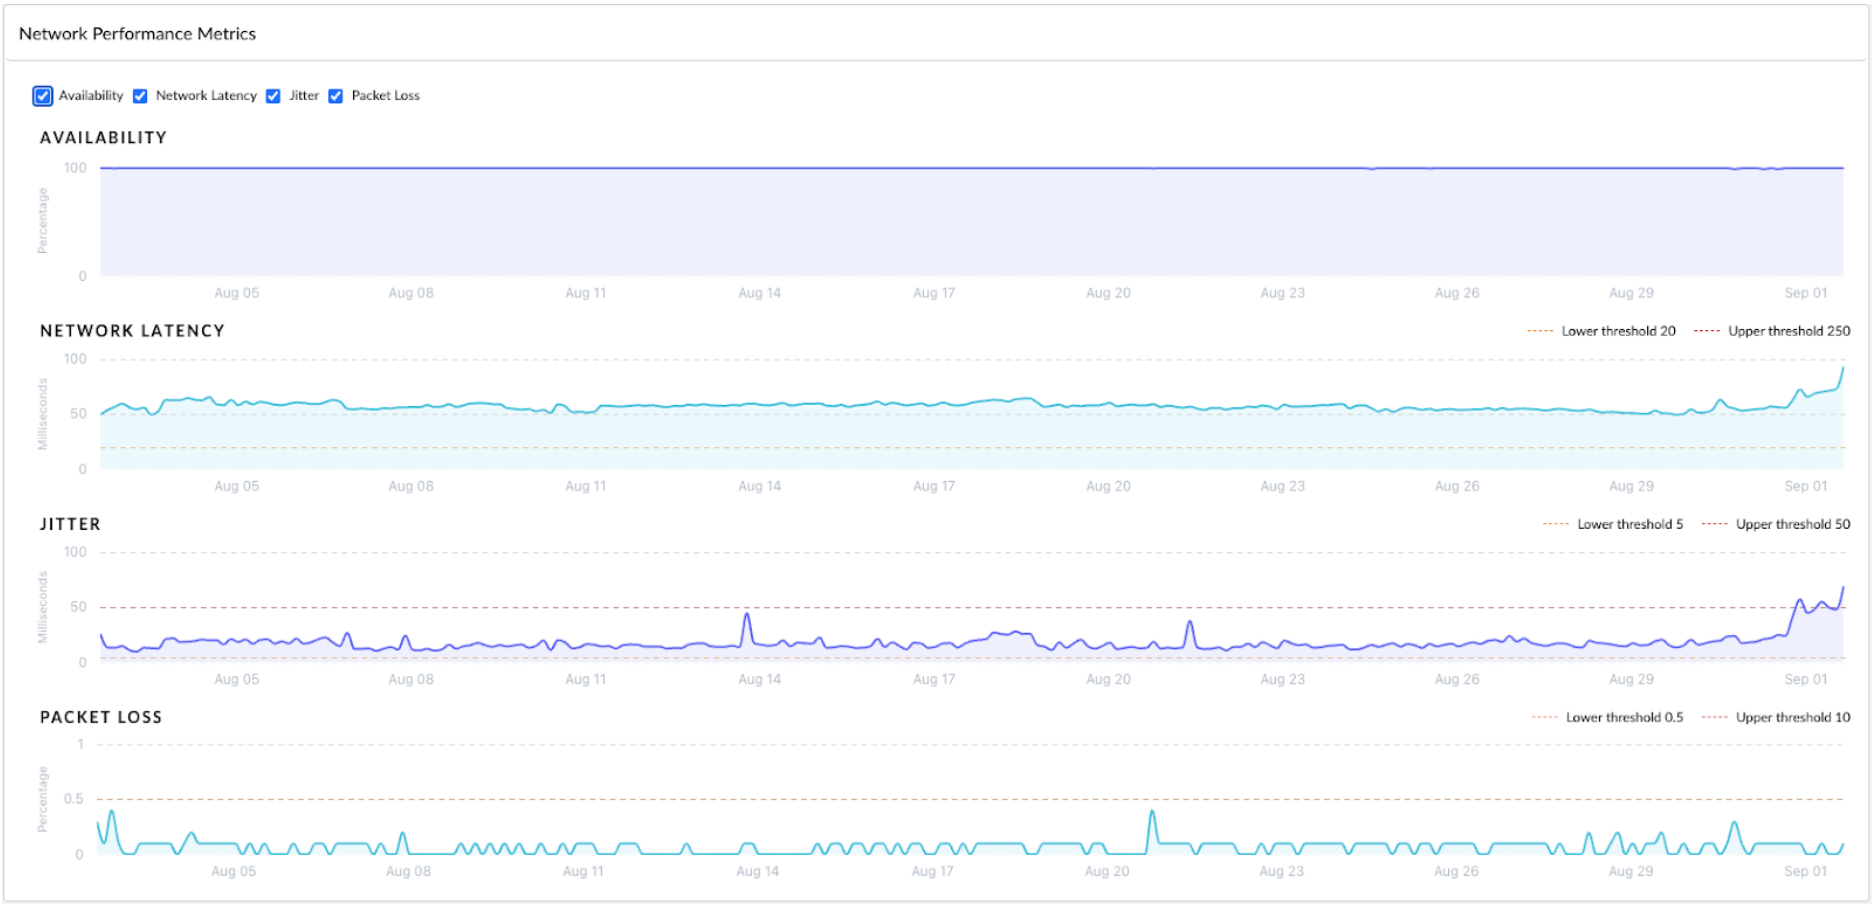
The attached screen is located in Monitor -> Applications -> Application details page in the Strata Cloud Manager UI.
The following shows the portions of the UI widget where the data is displayed for this example:
Request
GET https://api.sase.paloaltonetworks.com//adem/telemetry/v2/measure/internet/metric? timerange=last_30_day&filter=testUuid==3100bb11-dde4-4ab9-8503-d0c6ad5f9698&endpoint-type=muAgent&response-type=timeseries

header = { "prisma-tenant": "<tenant-id>" }
Response
{
    "startTime": 1691010000,
    "endTime": 1693602000,
    "endpointType": "muAgent",
    "tenantServiceGroup": [
         "<tenant-id>:<subtenant-id>”
    ],
    "samplePeriod": 10800,
    "series": [
        {
            "_rowCount": 352,
            "availability": 99.9,   <<<<<<
            "delay": 51399,   <<<<<<
            "maxDelay": 485085,
            "jitter": 17979.7,   <<<<<<
            "maxJitter": 1005062,
            "loss": 0.2,   <<<<<<
            "maxLoss": 60,
            "sample": 1691010000
        },
        {
            "_rowCount": 322,
            "availability": 100,
            "delay": 53642.5,
            "maxDelay": 477375,
            "jitter": 13411.3,
            "maxJitter": 851835,
            "loss": 0.1,
            "maxLoss": 14.3,
            "sample": 1691020800
        },
…….
]
}