for Palo Alto Networks
Access comprehensive developer documentation, API references, SDKs, and guides across the entire Palo Alto Networks product portfolio. Find everything you need to build integrations and automate security workflows.
Cloud Native Security
Discover the APIs, tools and techniques necessary for bringing DevOps practices to the cloud.
Prisma Cloud Enterprise Edition
Prisma Cloud Compute Edition
Security Operations
Browse reference docs, tutorials, the XSOAR Marketplace and more.
Cortex XSOAR
Cortex
Network Security
Learn how to make the most of the PAN-OS APIs, SDKs, Expedition, Terraform, Ansible, and more.
Prisma AIRS
PAN-OS
Cloud NGFW
Strata Logging Service
Cloud-Delivered Security Services
Expedition
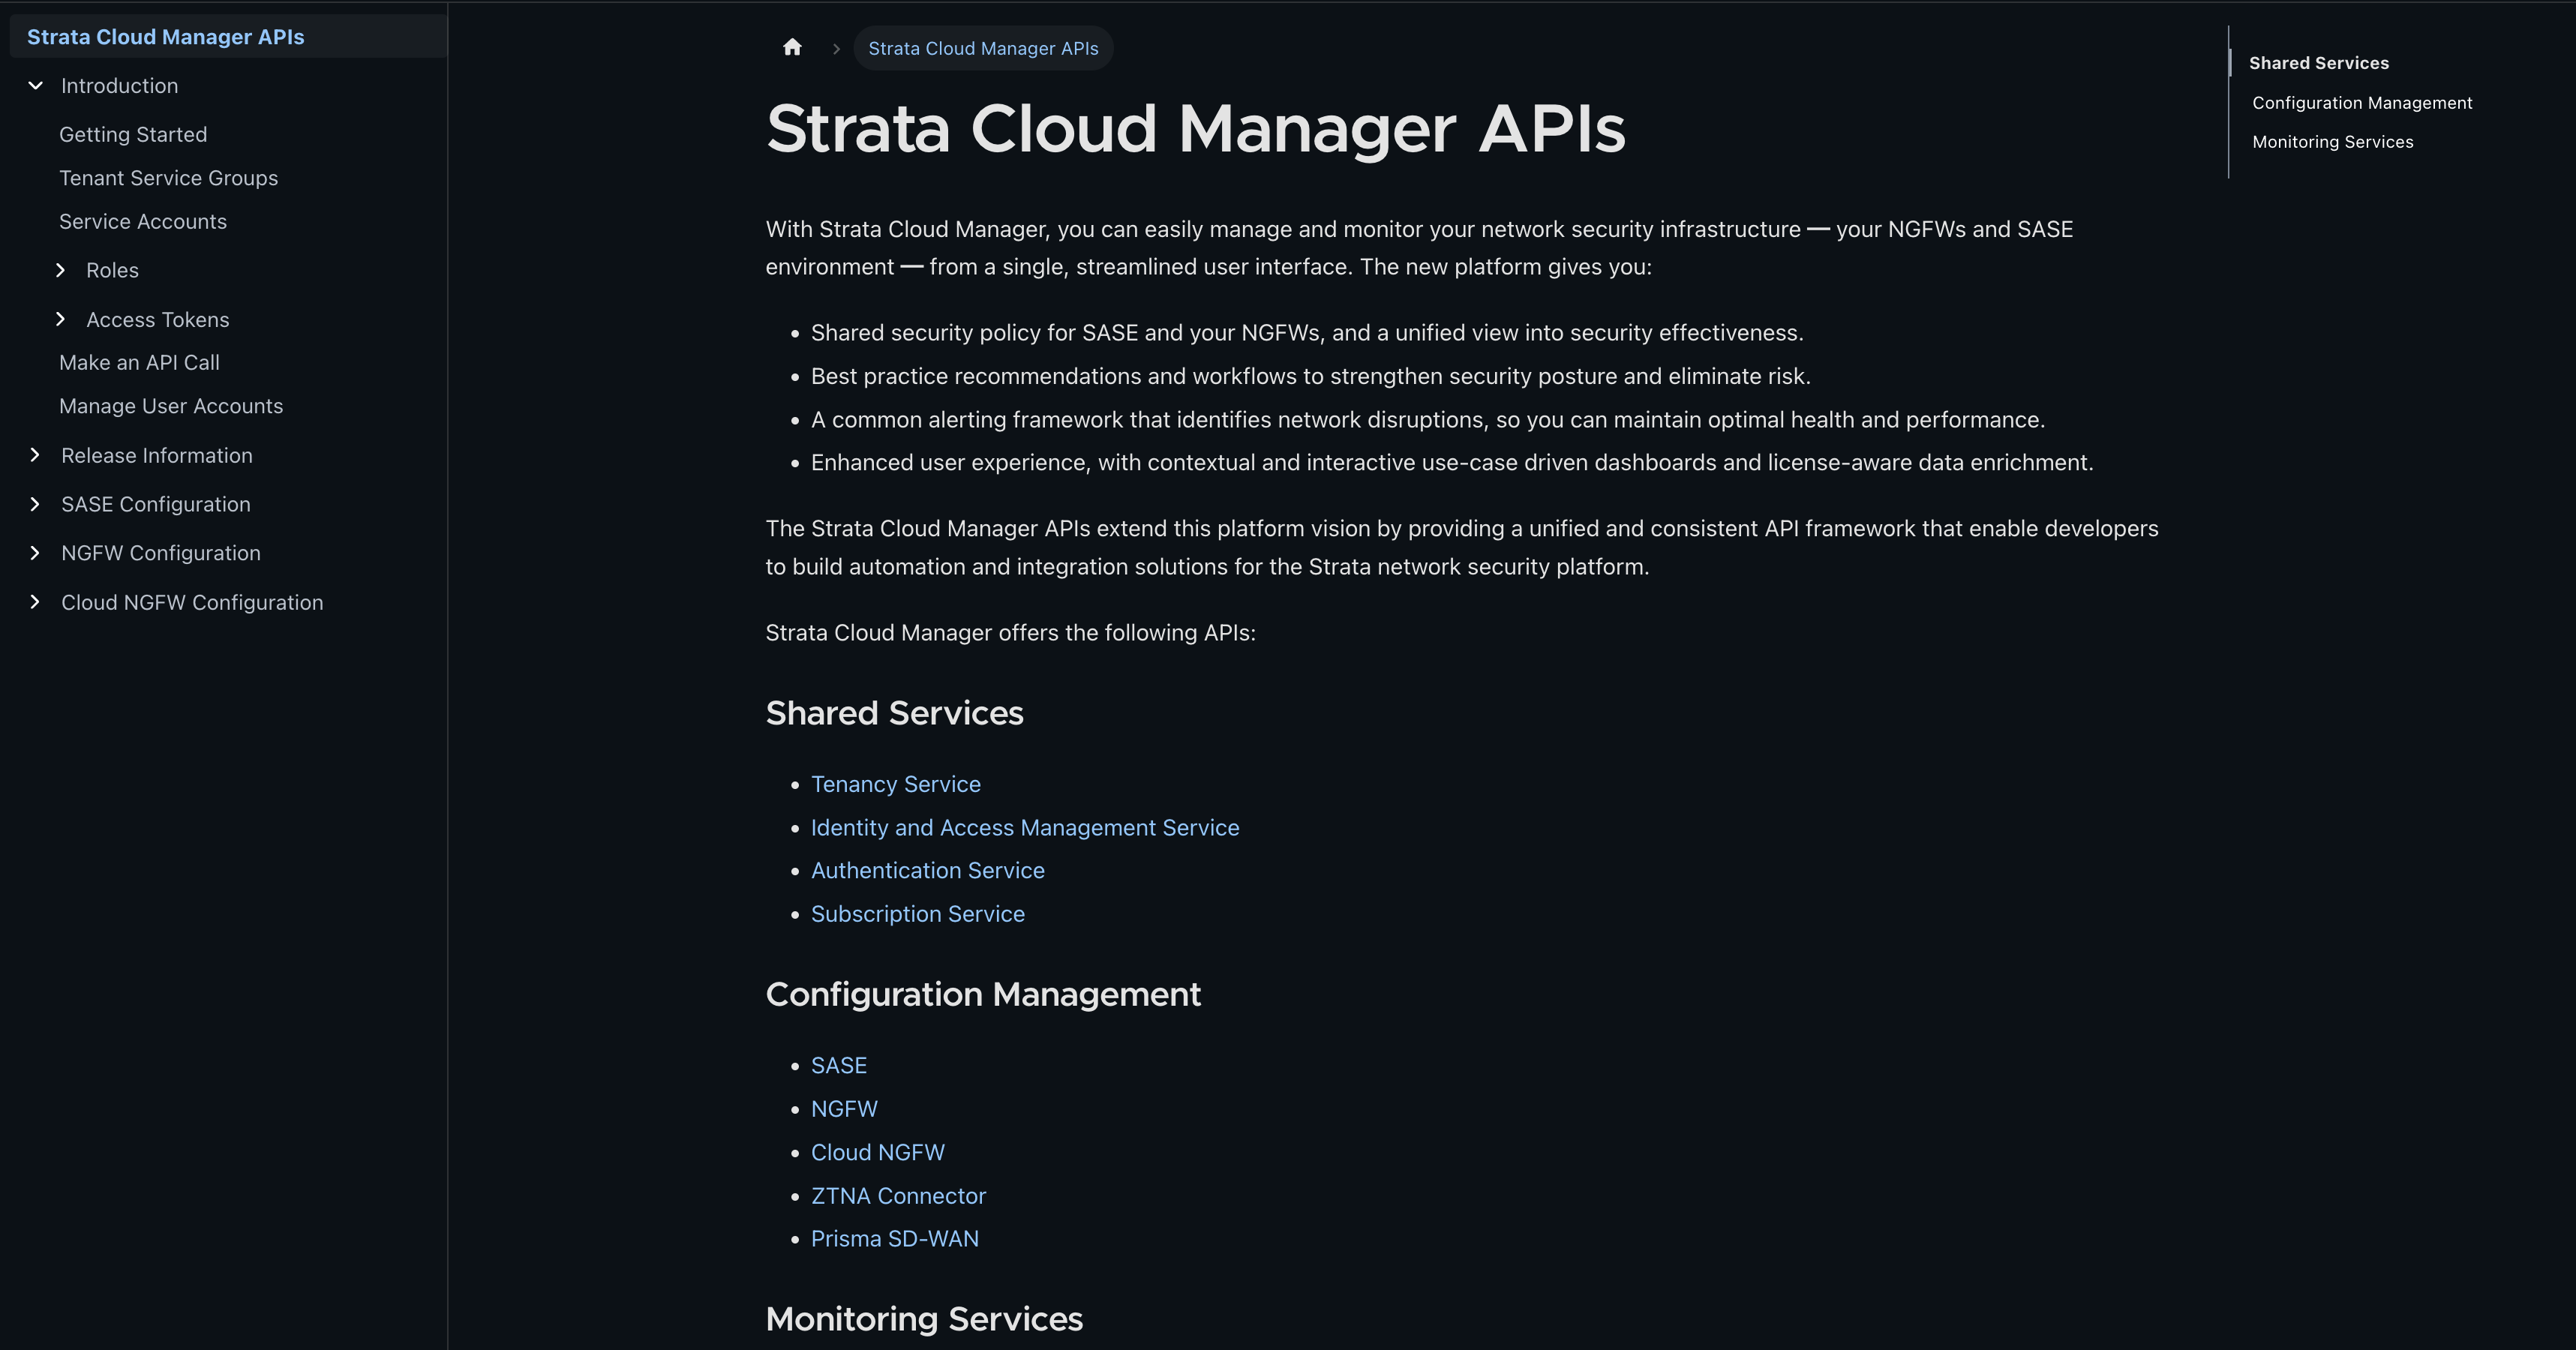
Strata Cloud Manager
Discover Strata Cloud Manager APIs.
Strata Cloud Manager
Secure Access Service Edge
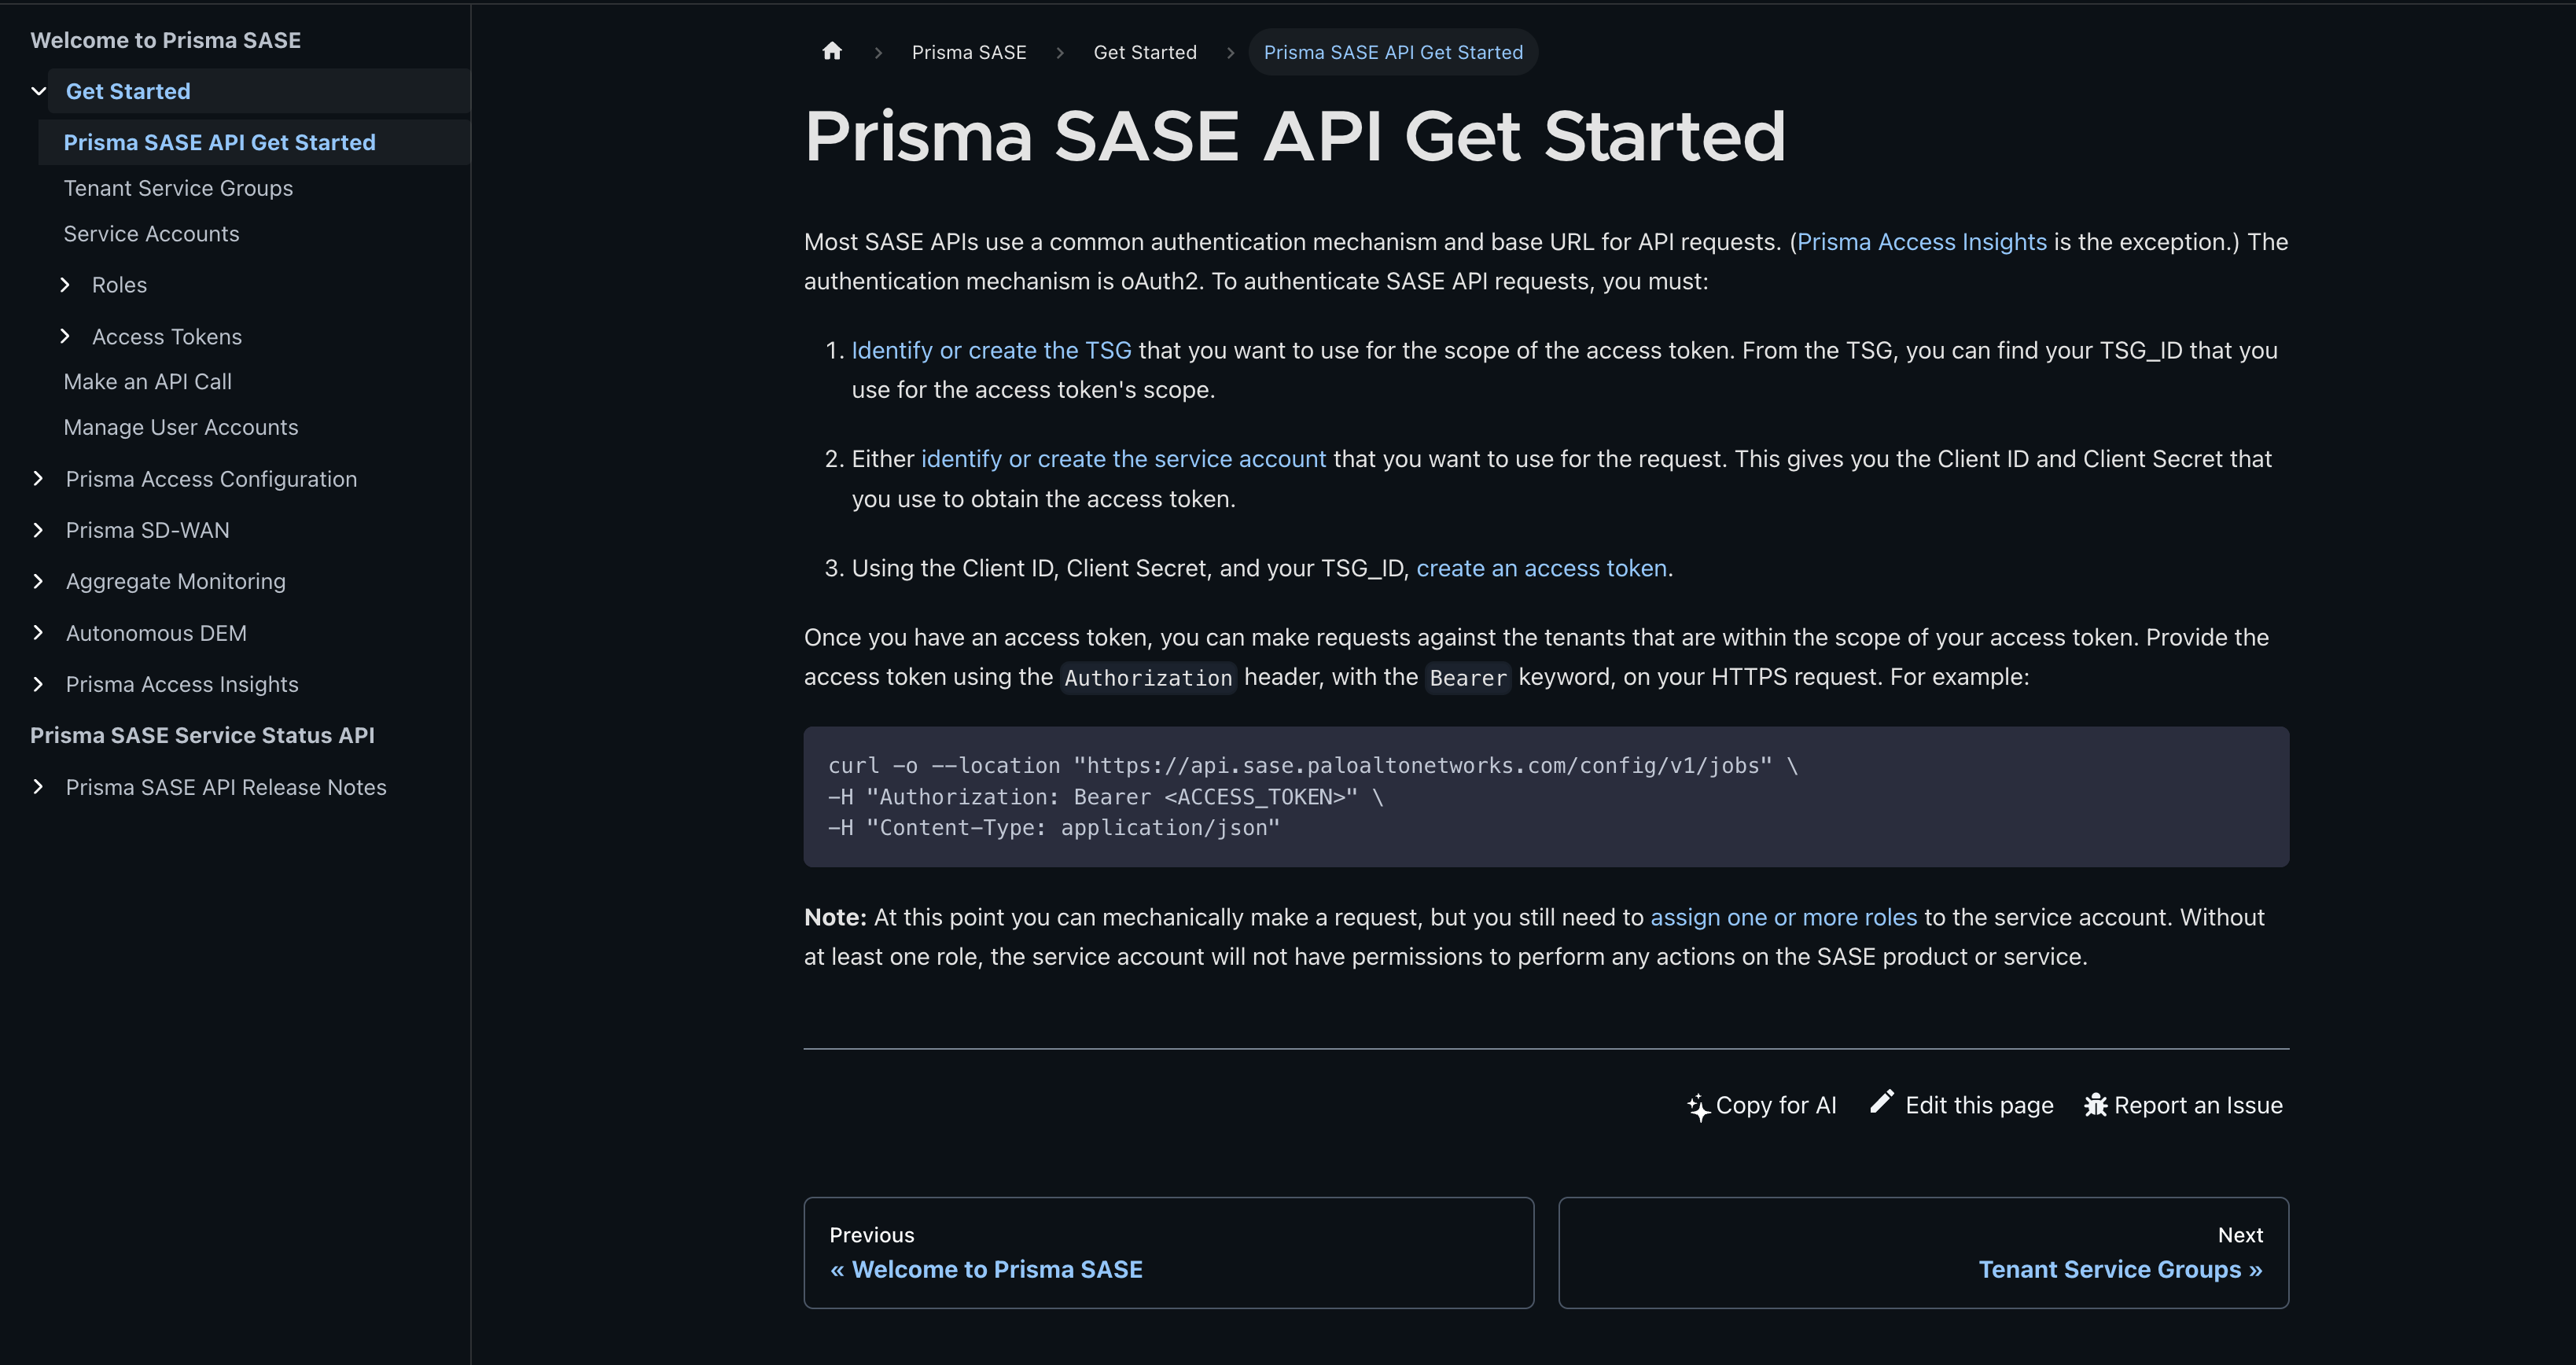
Discover Prisma SASE APIs, including Prisma Access and Prisma SD-WAN.
Prisma SASE
Prisma Access Configuration
Prisma Browser Management
Prisma Access Insights
Prisma SD-WAN
Prisma SASE Service Status
Partner Integrations
Discover technology partner integrations.
Automation
SIEM
Cross-Platform
Learn about opportunities across Palo Alto Networks platforms.
Service Status
Leverage validated Terraform Reference Architectures and Modules for VM-Series and CloudNGFW firewalls for rapid and reliable security in the cloud.
Hashicorp's Terraform is widely used to build and deploy infrastructure, safely and efficiently, with high levels of automation and integration.